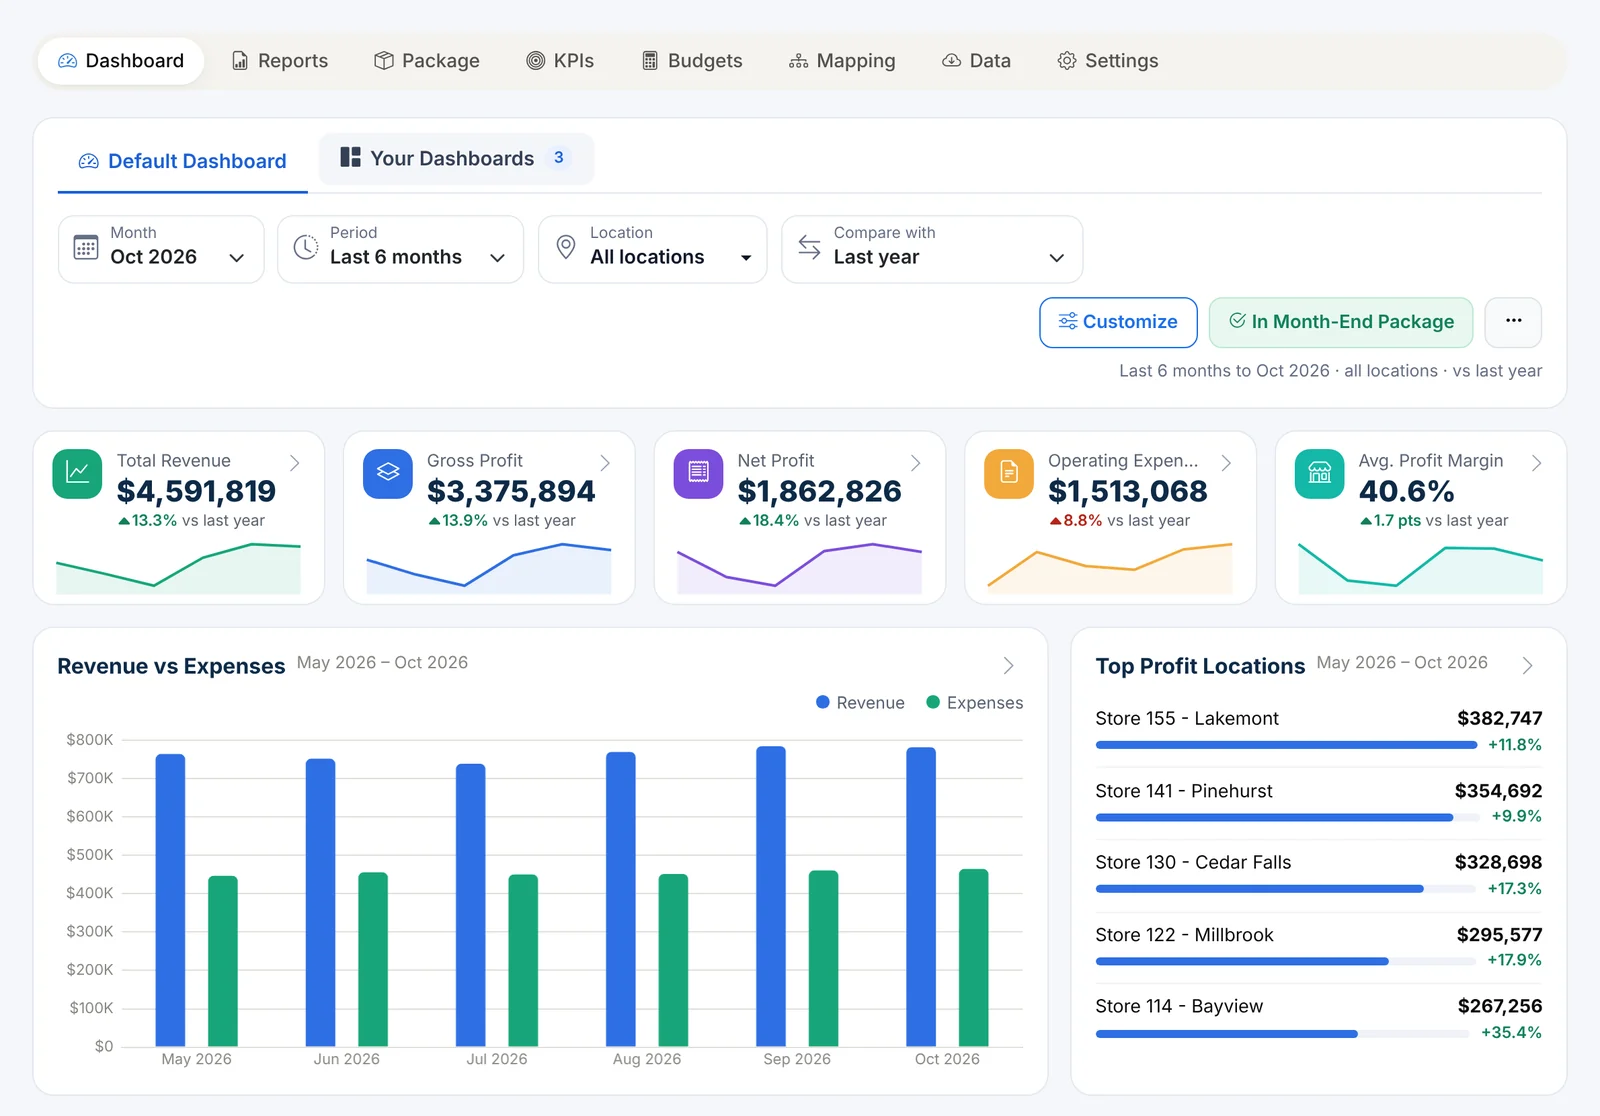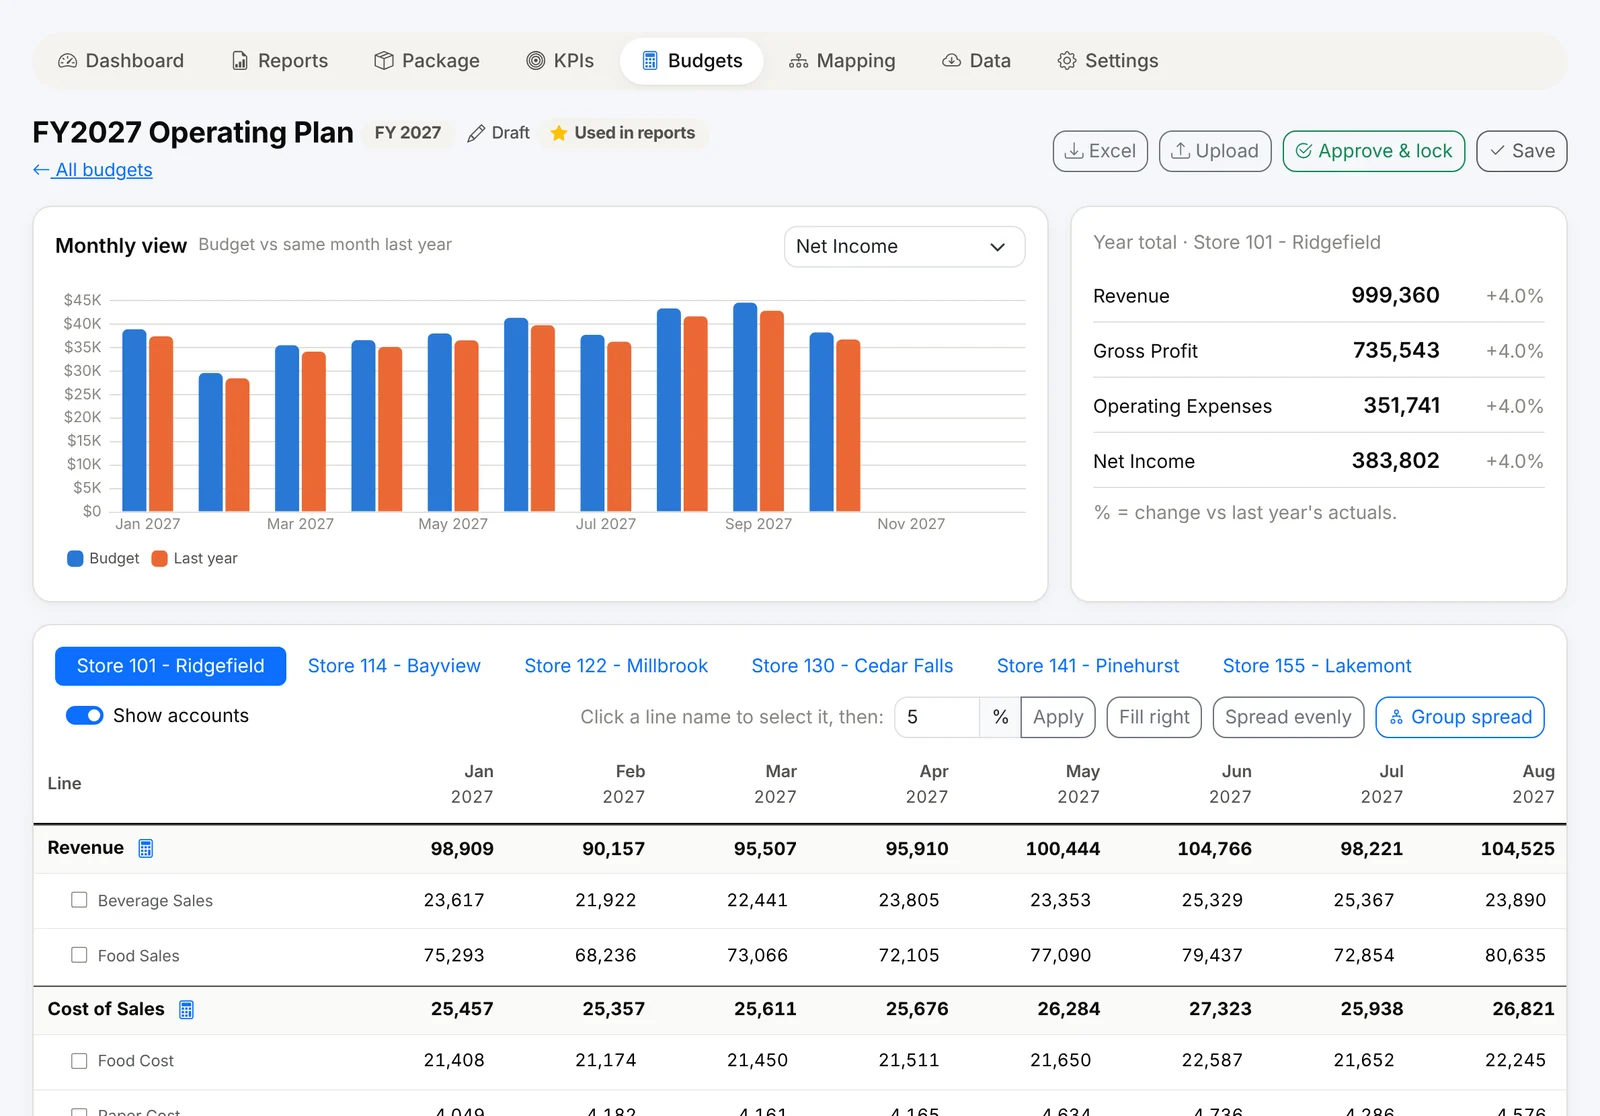
Month-end shouldn't mean three days of exporting, pasting and formatting. Finorbi gives you a library of ready-made reports, lets you save your own, tracks KPIs against targets, and assembles the whole month-end package in one click.
A report library built for multi-location businesses
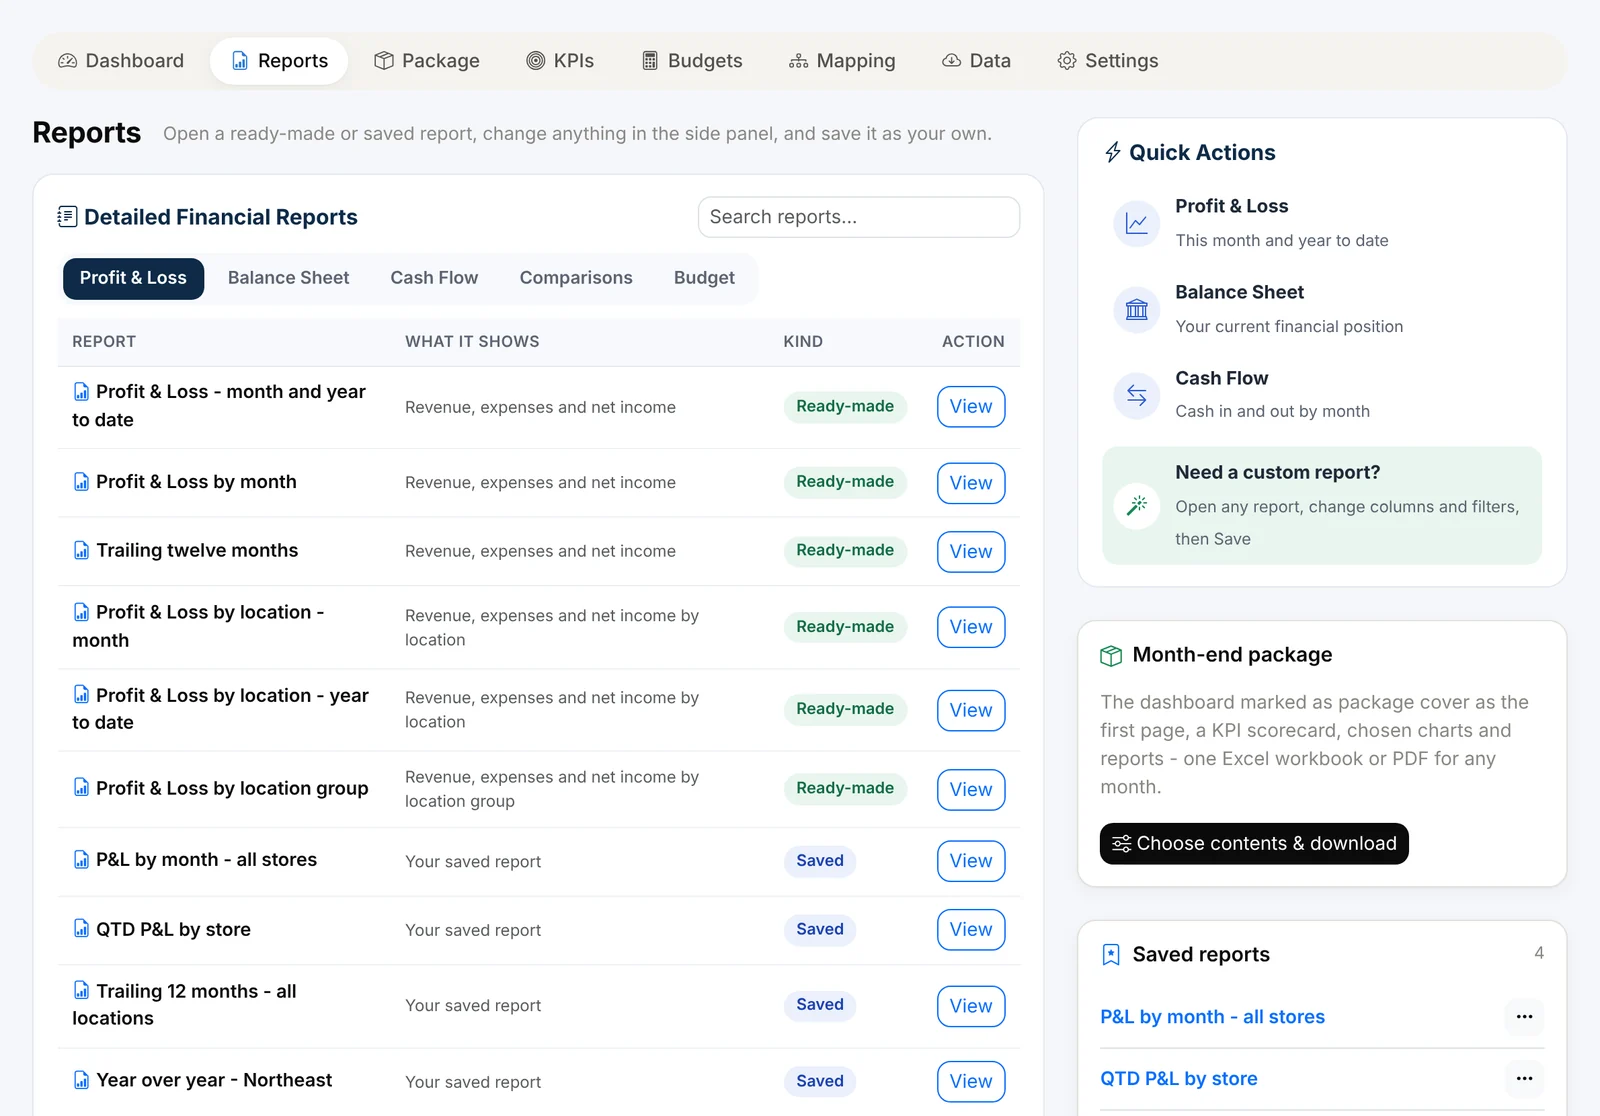
Ready-made reports include:
- Profit & Loss - month and year to date, by month, trailing twelve months,
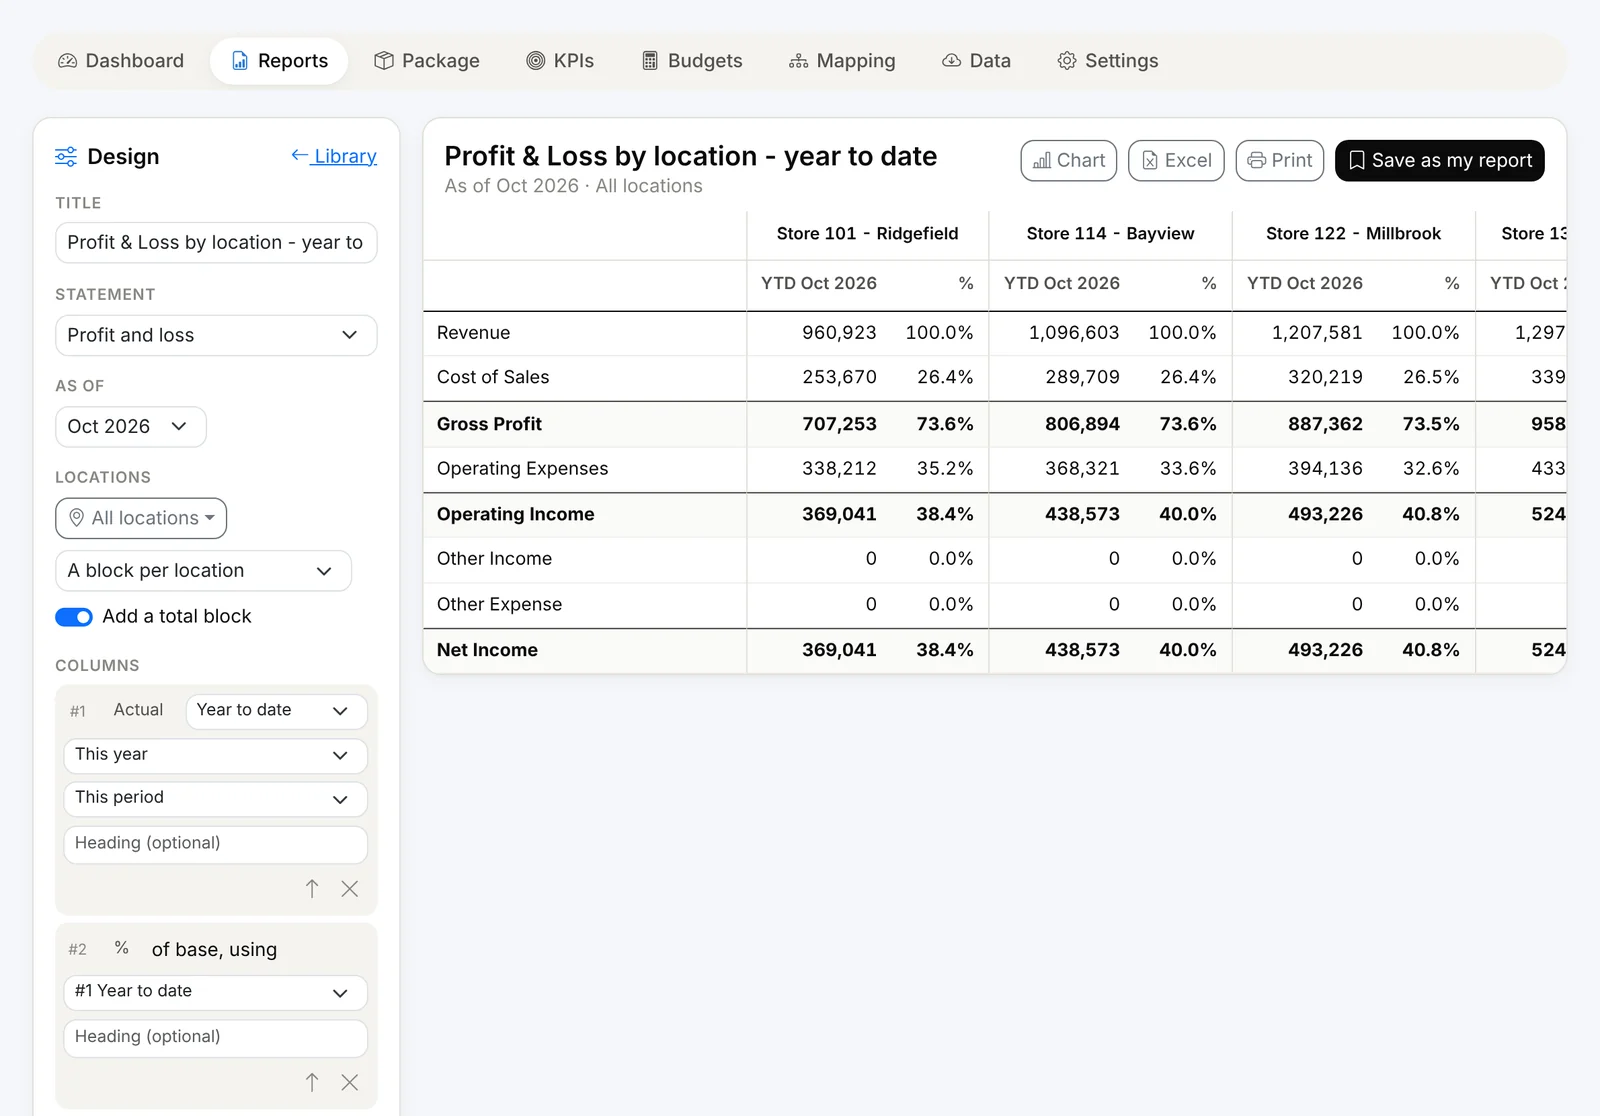
- P&L by location (month or year to date) and by location group,
- Comparisons - year over year, month over month, compare locations, actual vs budget,
- Budget by month,
- Balance sheet - by month, vs prior month and prior year, by location,
- Cash flow by month,
- Account schedules for any line.
Make any report your own
Open a report and change anything in the side panel: the month, the columns (actual, budget, last year, differences, % of a base line), the locations or groups, and how they're laid out. Save it as your own report and it appears in Saved Reports for everyone on your team. Click through any line to see the accounts behind it. Export to Excel (fully formatted) or print to PDF.
Your report lines, your structure
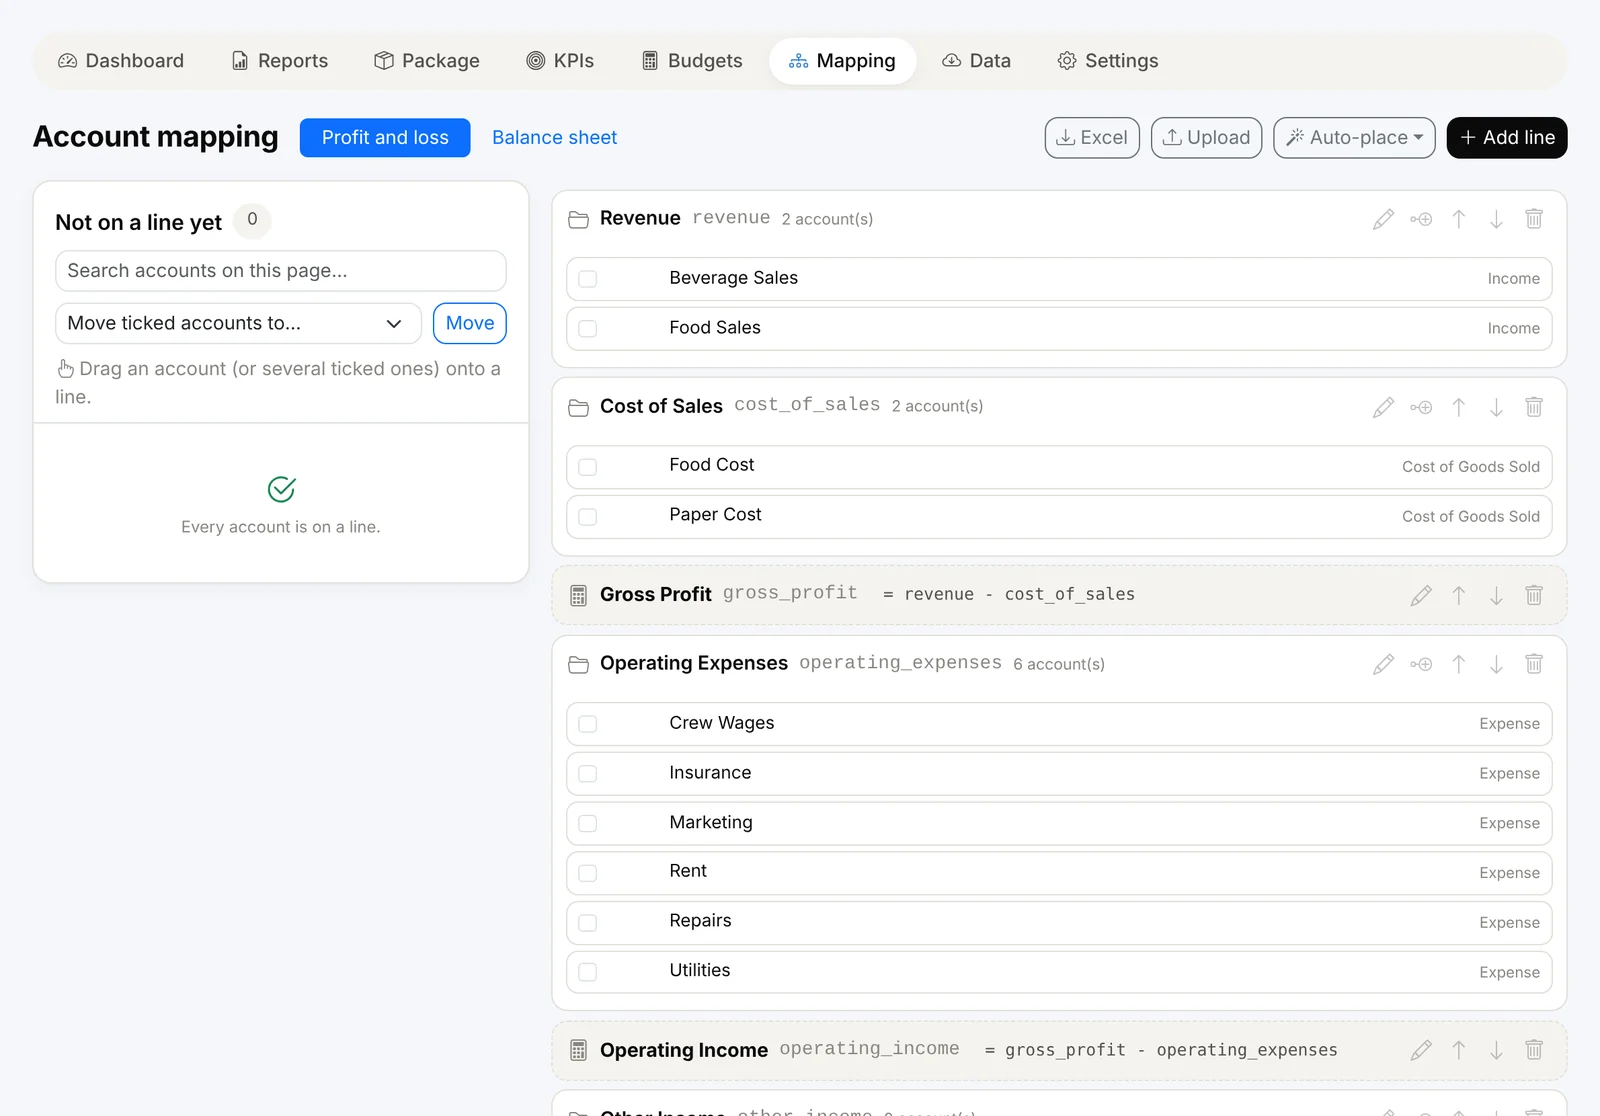
Every account in your chart of accounts is mapped to a report line once - drag an account to move it, add your own lines and subtotals, or use formulas. Bring in history from QuickBooks Online or Excel, and keep this month and last month refreshed automatically. Location groups (regions, districts, acquisitions) can be used in every report, dashboard, KPI and budget.
KPIs with targets
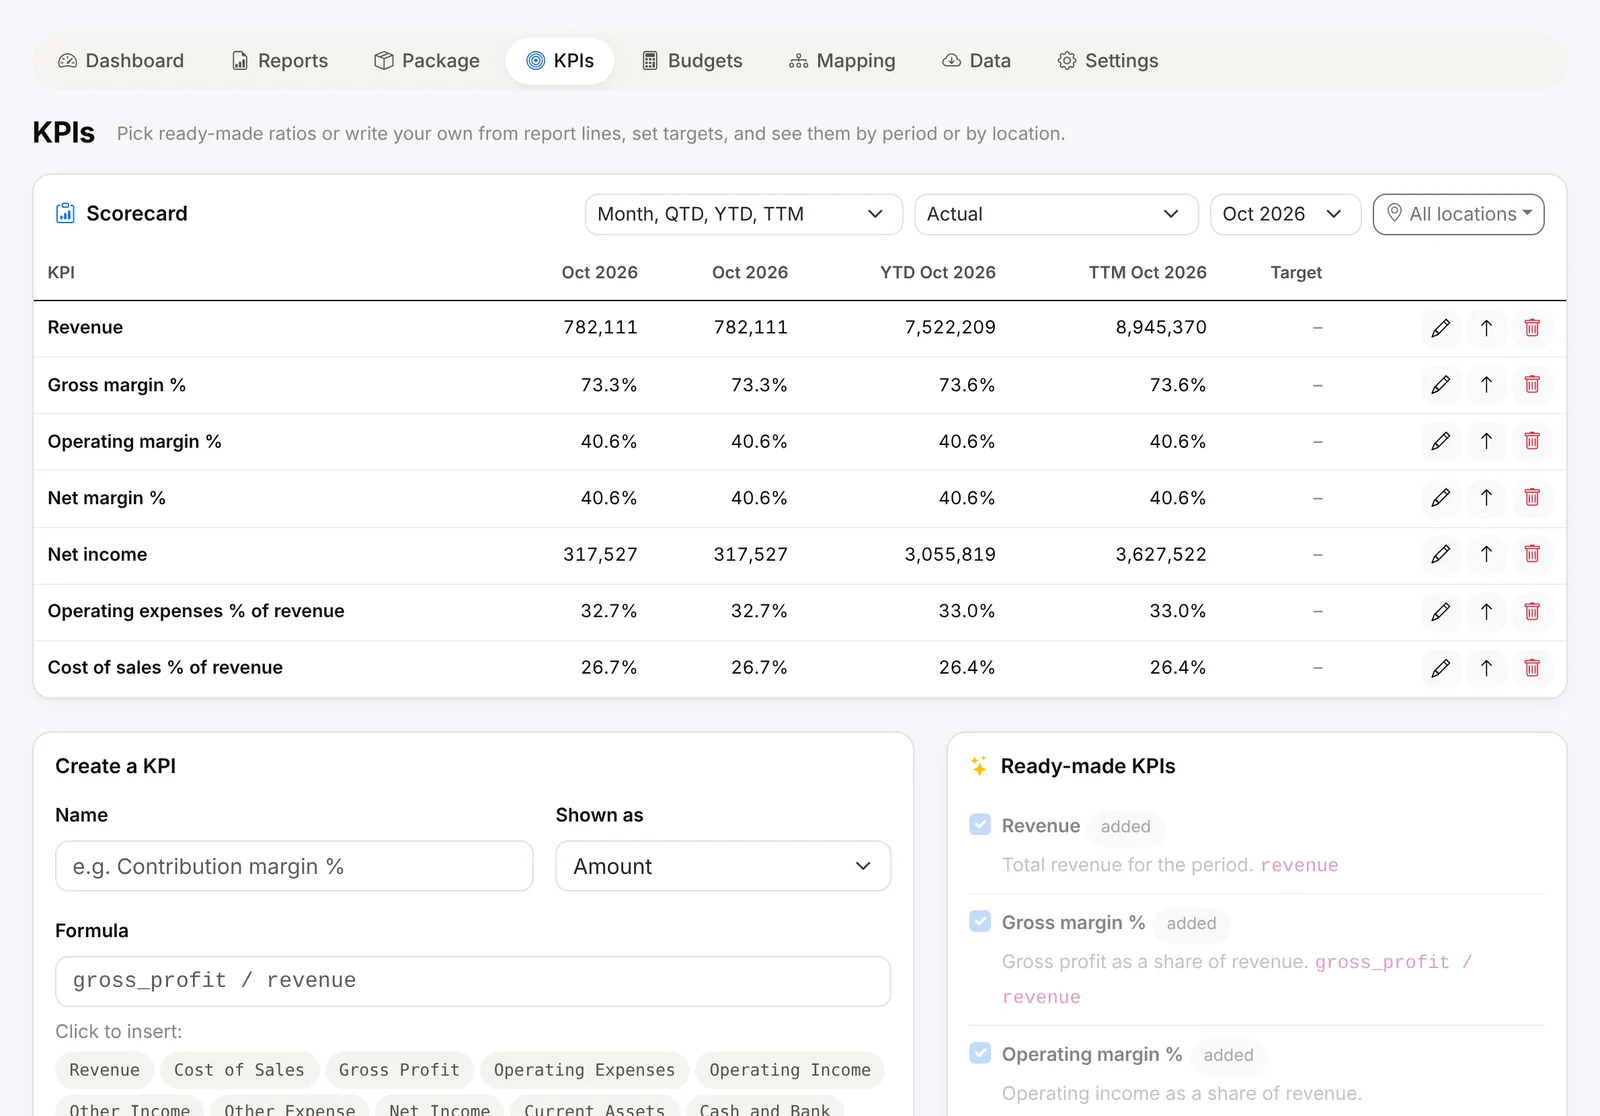
Choose from ready-made KPIs - gross margin %, operating margin %, net margin %, cost of sales % of revenue, operating expenses % of revenue and more - or write your own from report lines (for example, gross_profit / revenue). Set a target and whether higher or lower is better, and Finorbi shows each KPI as on target, close or off target.
View the scorecard by month, QTD, YTD and trailing 12 months, month by month, by location or location group, or as actual vs budget vs last year with differences.
The month-end package in one click
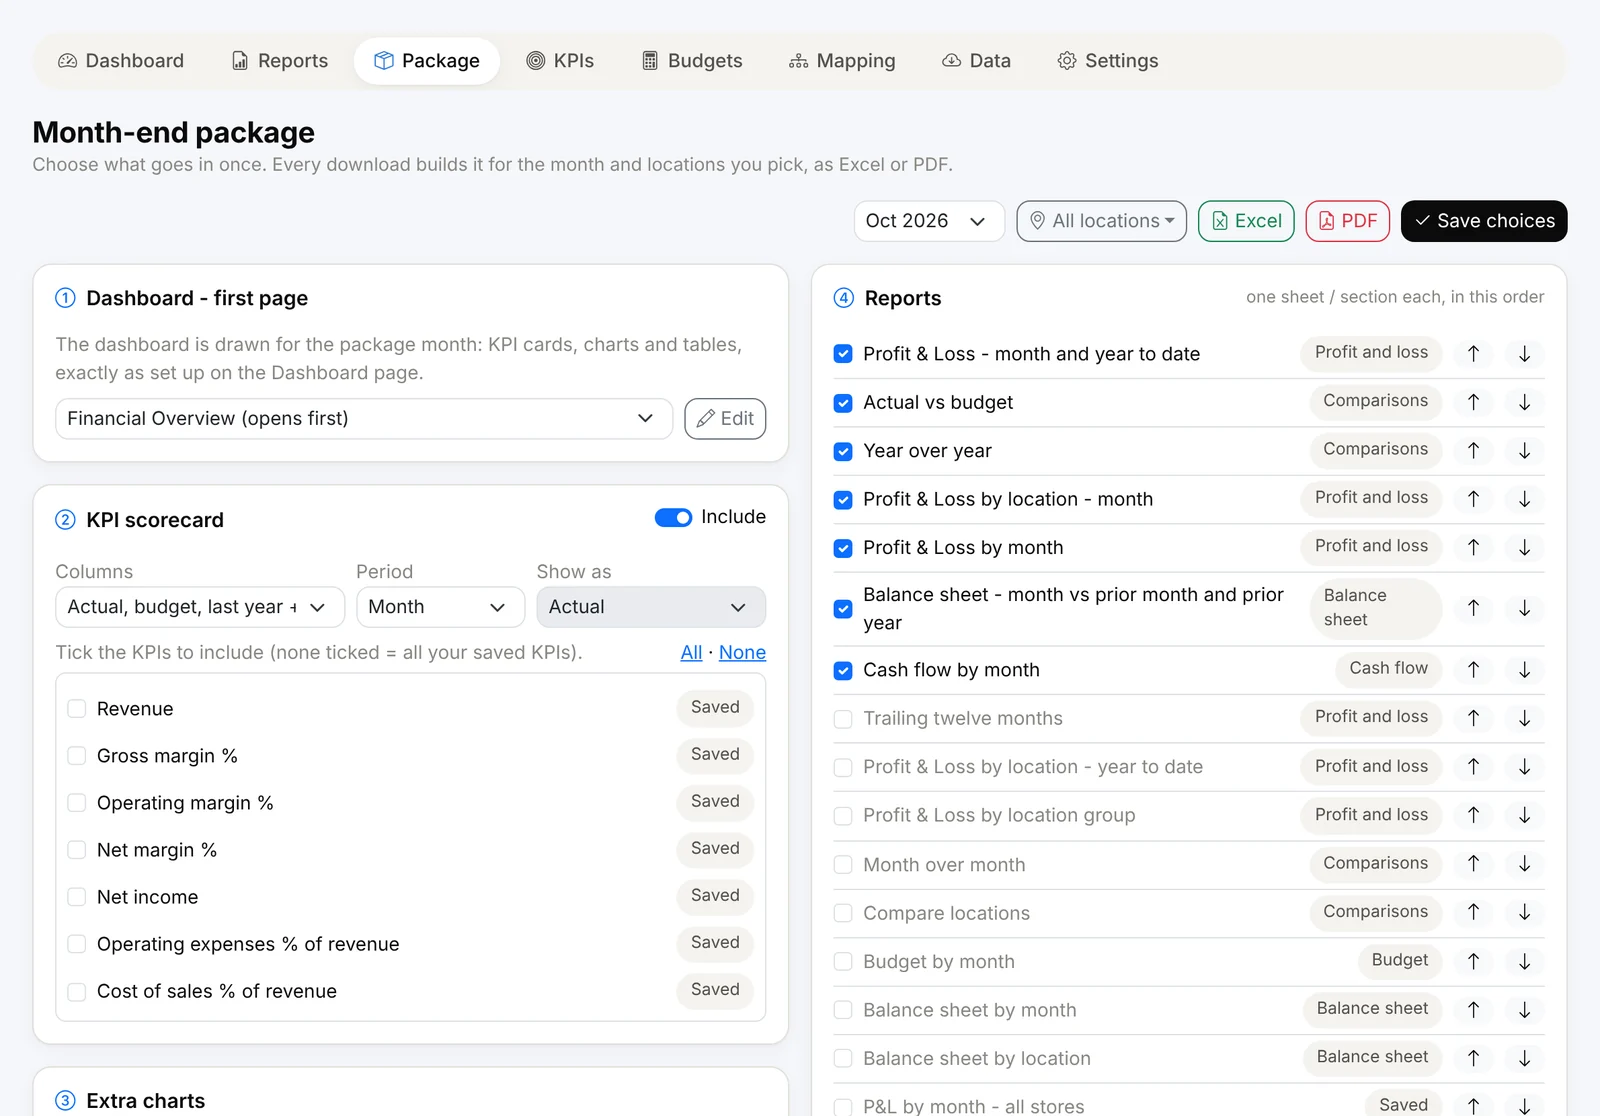
Choose what goes in once:
- Cover dashboard - any dashboard, drawn for the package month (set it with Add to Month-End Package on the dashboard),
- KPI scorecard - the KPIs, columns and period you choose,
- Charts - any extra charts from any dashboard,
- Reports - ready-made or saved, in the order you want.
Then download it as one Excel workbook (a contents page, a formatted sheet per report, native charts) or one PDF - for any month and any location or group.
Reports, KPIs and the month-end package are included from the Professional plan and in the 14-day full trial.