QuickBooks Online is excellent at recording transactions. Getting a clear, current picture of how each location is performing - and comparing it with last year or your budget - usually means exporting reports and rebuilding the same spreadsheet every month.
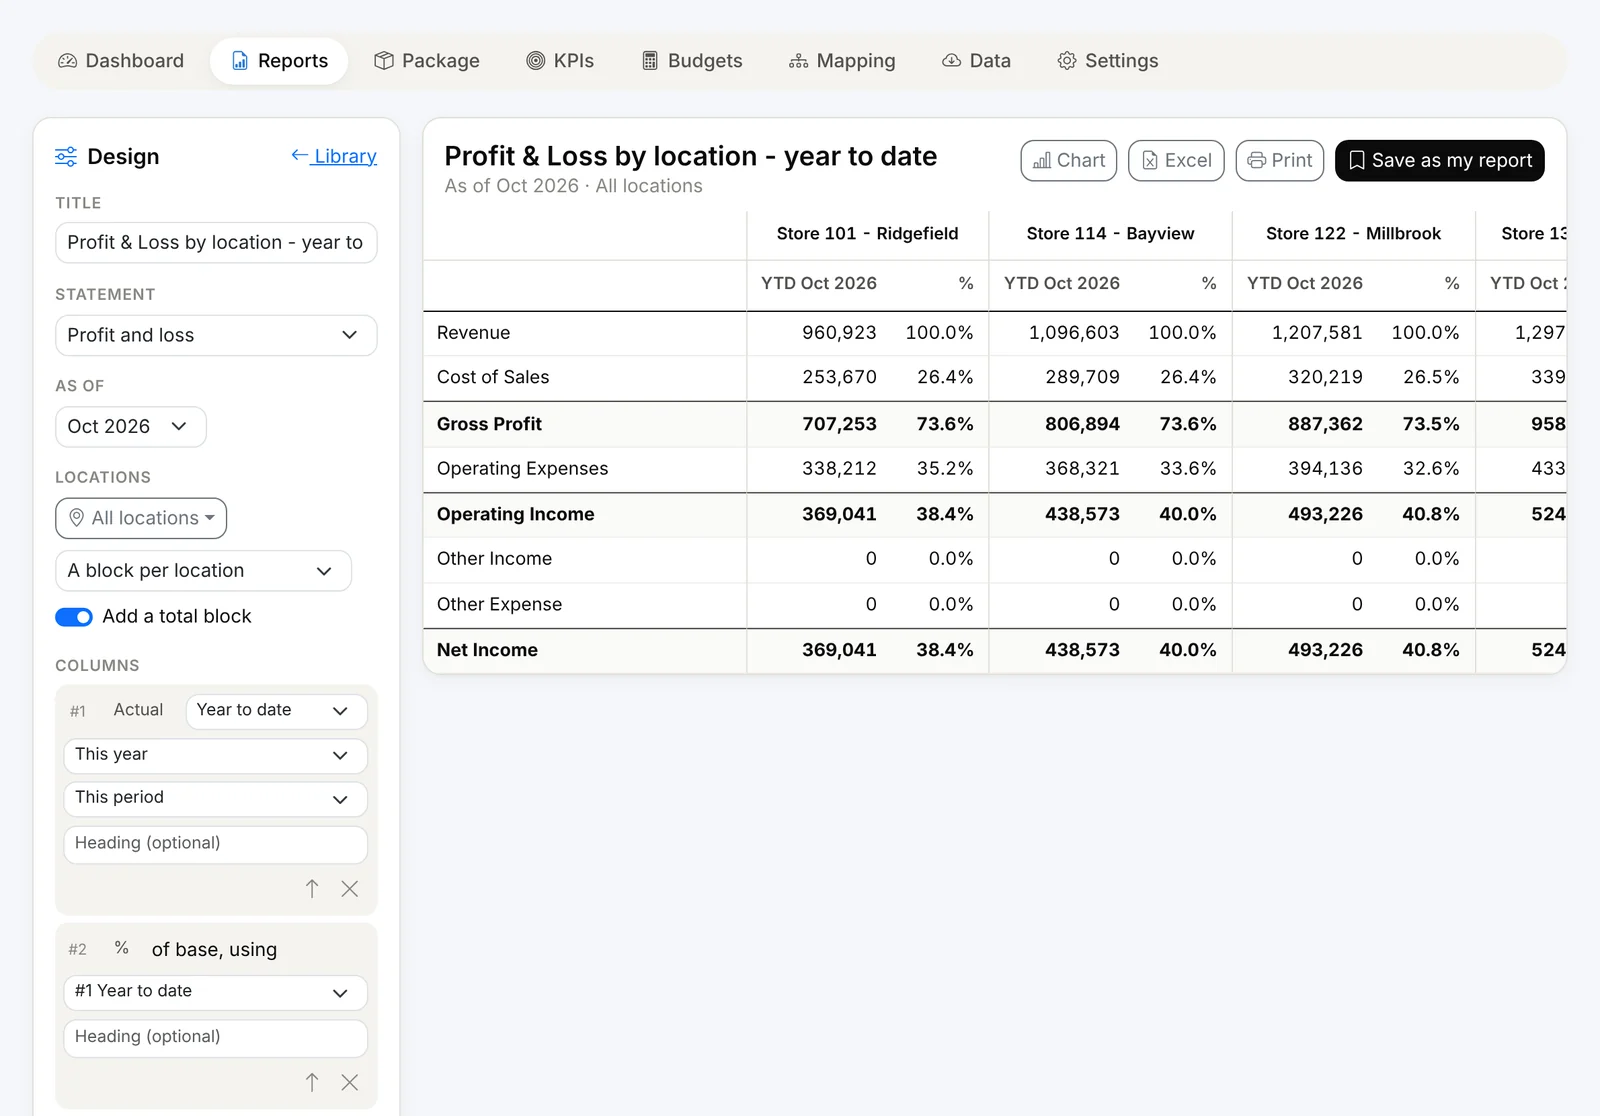
Financial Intelligence in Finorbi turns your QuickBooks Online data into live dashboards, reports, KPIs, budgets and a month-end package - by location, location group or the whole company.
The Default Dashboard
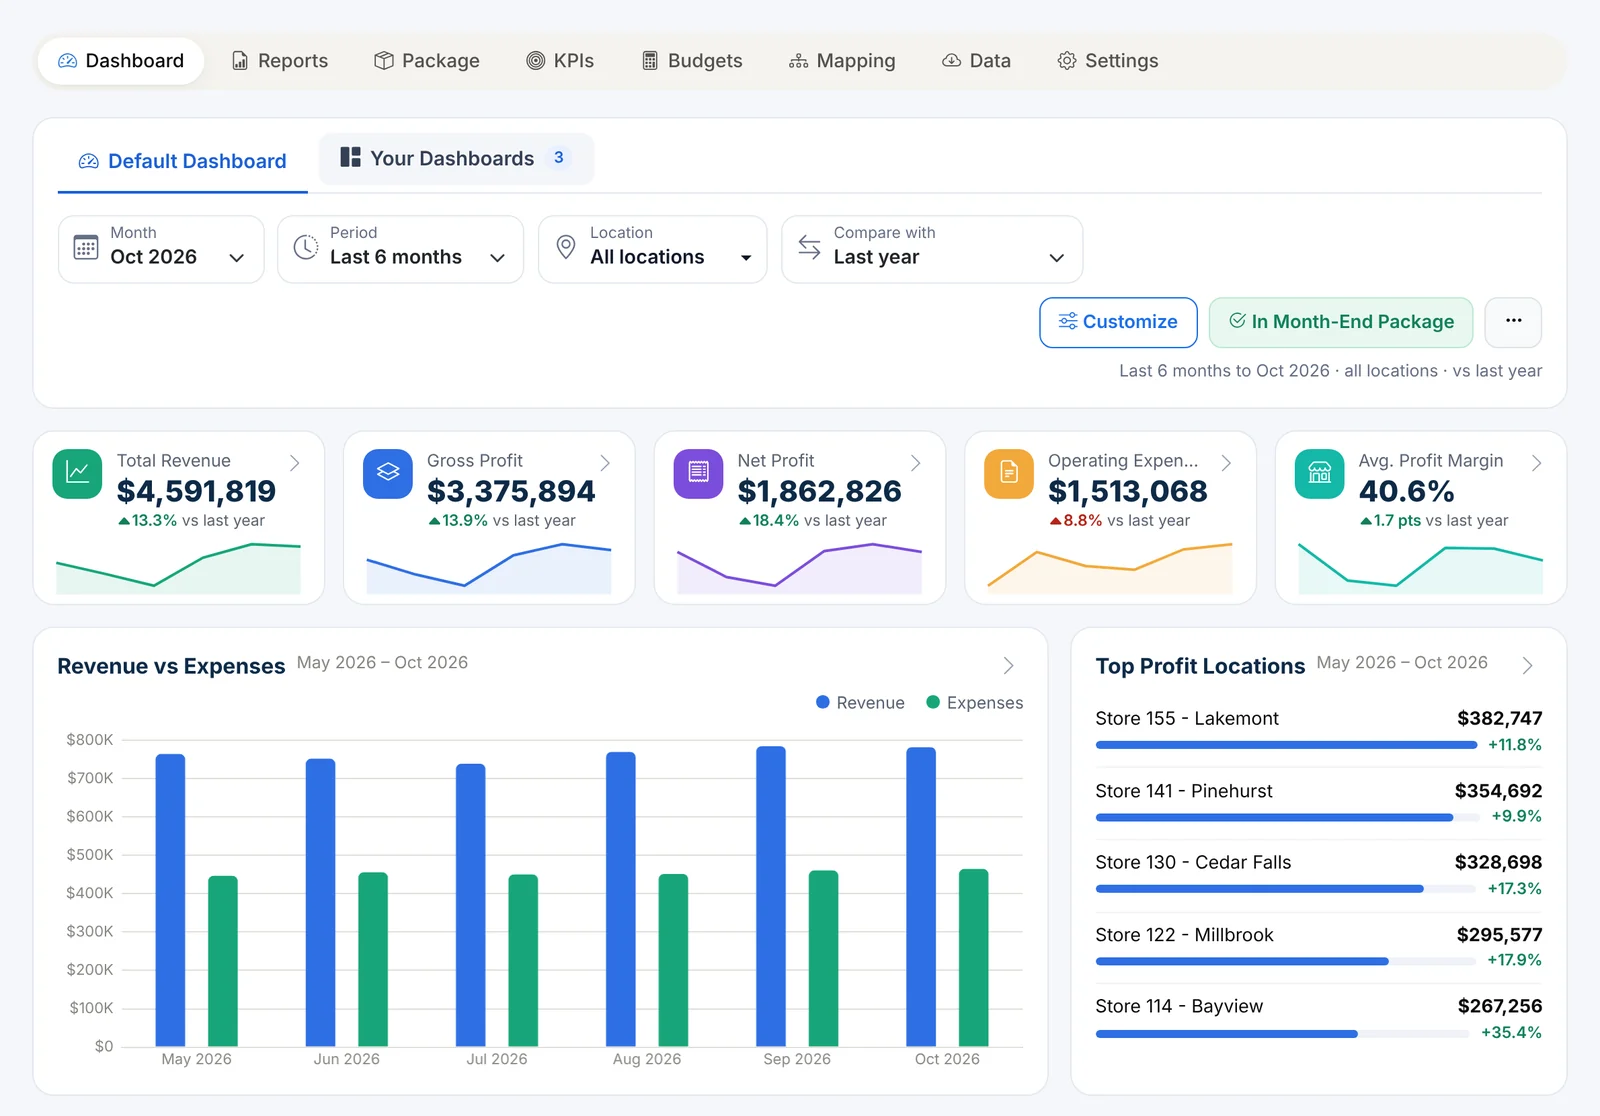
Open Financial Reports and the essentials are already there:
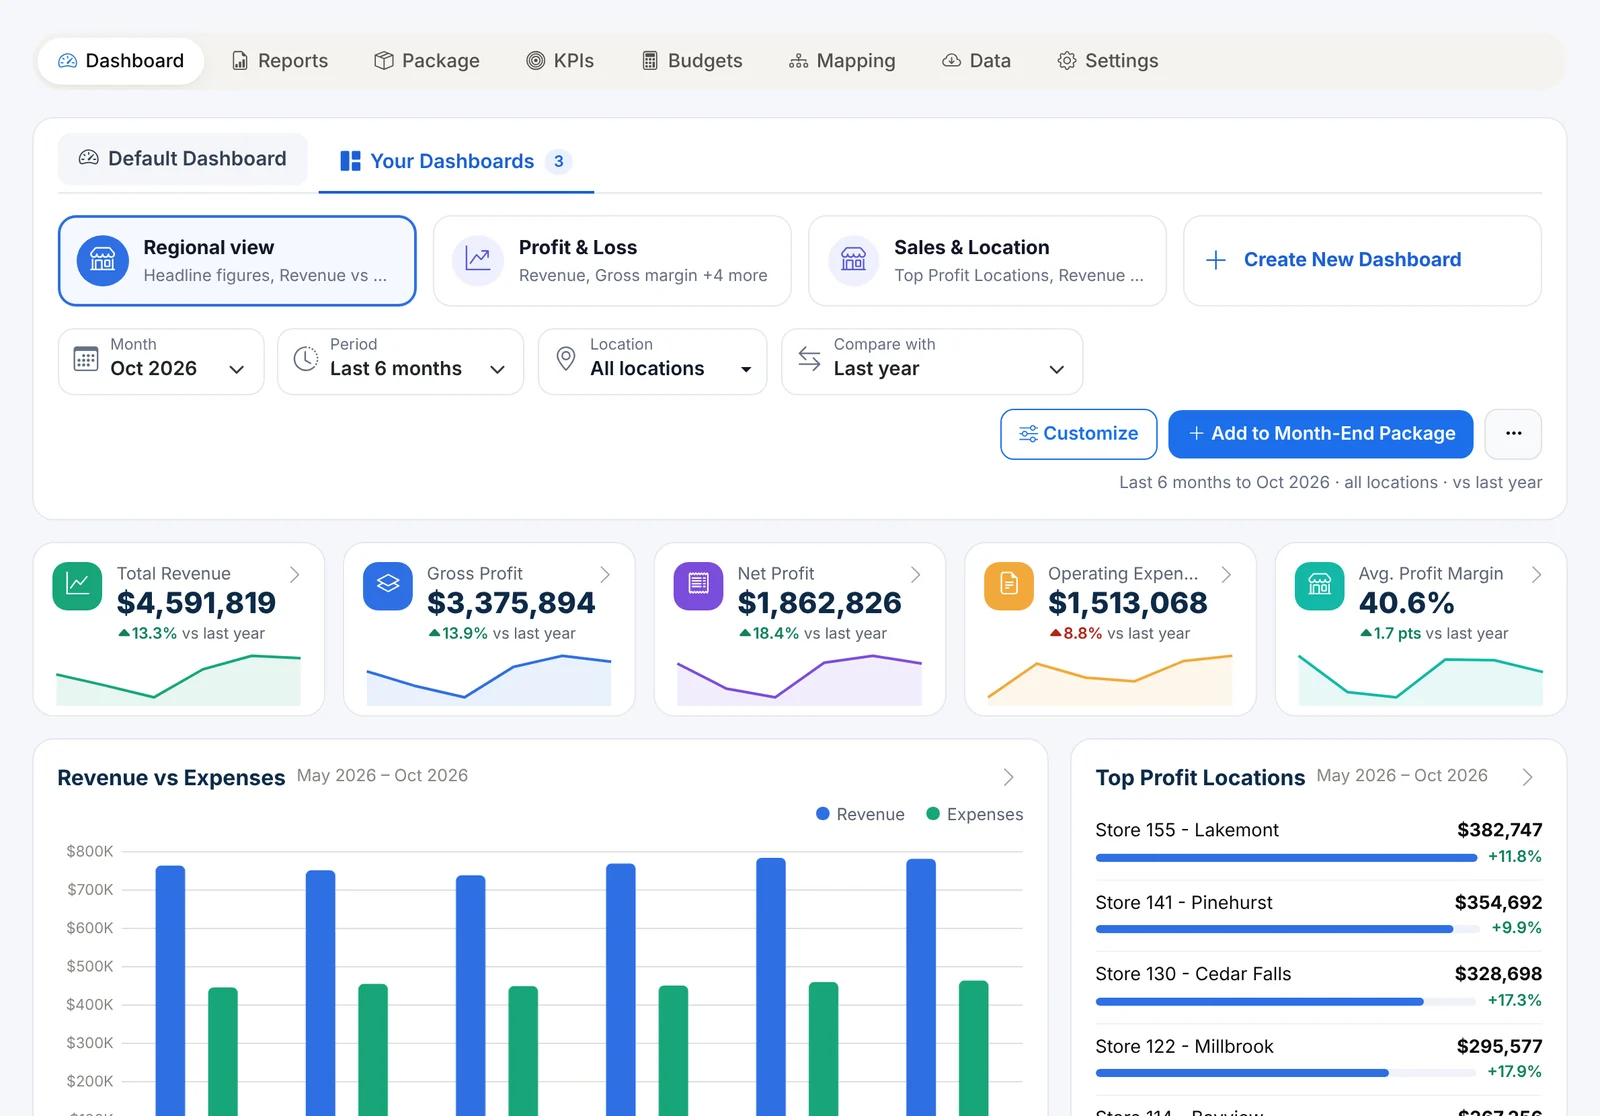
- Headline figures - Total Revenue, Gross Profit, Net Profit, Operating Expenses and Average Profit Margin, each with its change and a trend line. Click any figure to open the Profit & Loss behind it.
- Revenue vs Expenses - month by month, side by side.
- Top Profit Locations - your best stores ranked, with change vs last year.
- Expense Breakdown - where the money goes: cost of sales and each expense group.
- Profit bridge - from revenue down to net income for the period.
One set of filters for everything
At the top of every dashboard:
- Month - any month you have figures for (for example, Oct 2026).
- Period - Month, Quarter to date, Year to date, Last 3, 6 or 12 months, or the full fiscal year.
- Location - all locations, one location group (such as a region or district), or any combination of individual stores.
- Compare with - last year, budget, both, or the prior period.
Every widget follows the same filters, and your choices carry over as you move between dashboards.
Your Dashboards
Every team looks at numbers differently. Under Your Dashboards you can build as many as you like - a regional view for district managers, a lender view, a cash view - from the same building blocks:
- headline figure cards and KPI cards with sparklines,
- trend lines and bars by month (against budget or last year),
- bars by location or location group,
- heatmaps (a measure by location and month),
- profit bridge and expense mix,
- KPI scorecards and full report tables.
Start from the Default Dashboard, from a set of KPI cards and charts, or from a blank page. Any widget can be pinned to its own period or locations, or follow the dashboard's filters.
Always up to date
Finorbi refreshes figures from QuickBooks Online automatically (this month and last month stay current), and you can bring in earlier history from Excel. Each account is mapped to your own report lines once - drag an account to move it - so every dashboard, report, KPI and budget uses the same structure.
The month-end package in one click
Any dashboard can be the cover page of your month-end package - choose Add to Month-End Package on that dashboard. The package combines the dashboard, a KPI scorecard, chosen charts and reports into one Excel workbook or PDF for any month. (See Reports, KPIs and the Month-End Package.)
And budgets - right in the app
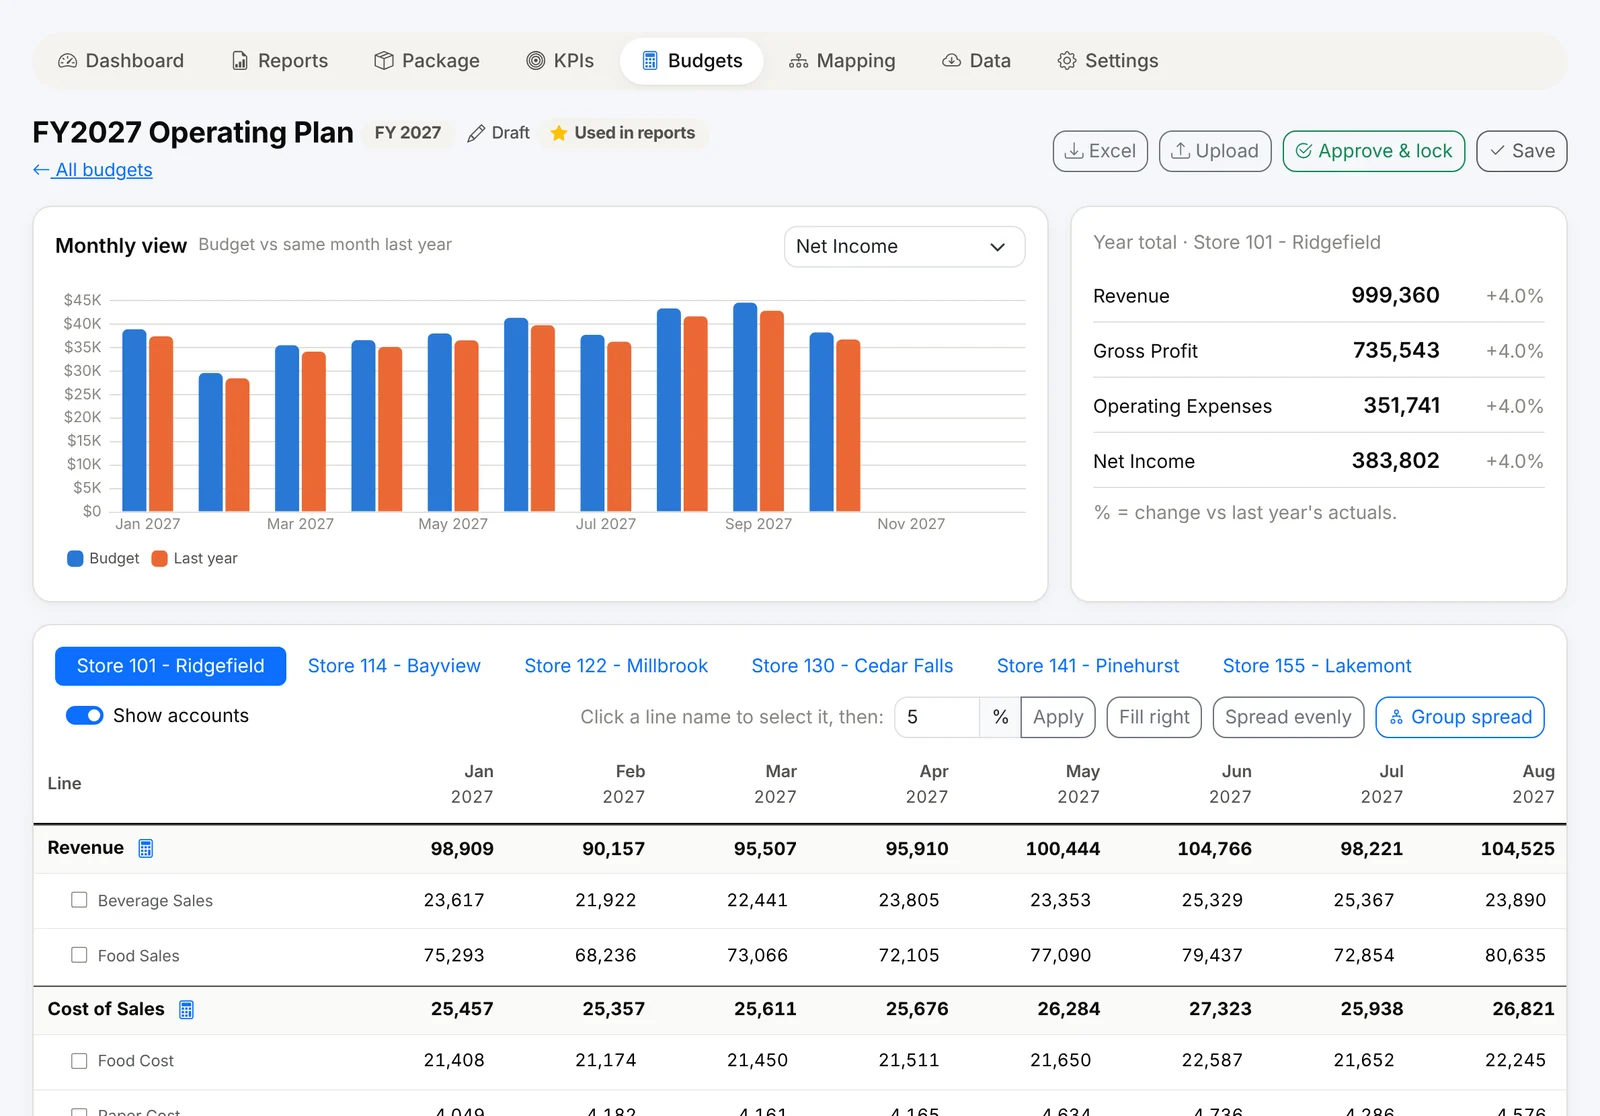
You don't need a separate budgeting tool. Finorbi lets you build budgets by location from last year's actuals, compare actual vs budget on every dashboard and report, and lock an approved version. (See Budgeting Inside Finorbi.)
Who it's for
Owners and CFOs who want one view of every location; district and area managers who need their stores' numbers; accountants who prepare the monthly package; and lenders and investors who need consistent reporting.
Financial Intelligence is included from the Professional plan up, and in the 14-day full trial.